
News
Business Intelligence
StatsCan building permits report: February 2022
April 14, 2022 By Stats Canada
The total value of building permits rose 21.0% to a record $12.4 billion in February, with British Columbia (+130.2%) leading the way. Construction intentions in the residential sector were up 9.8%, while the non-residential sector jumped 43.2%, driven mainly by large hospital permits in British Columbia and Quebec.
On a constant dollar basis (2012=100), the total value of building permits increased 22.1% in February.
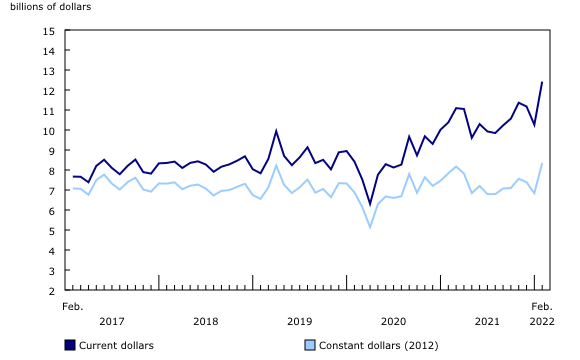
Total value of building permits, seasonally adjusted.
Residential sector up in February
Construction intentions in February for the residential sector rose 9.8% to $7.5 billion at the national level, with nine provinces reporting gains.
Gains in multi-family permit values in British Columbia (+57.9%) reversed January’s decline and contributed to the 18.5% increase at the national level, along with the gains in seven other provinces.
The total value of single family home permits rose 1.5% in February. Seven provinces reported increases.
Large hospital permits push non-residential sector to new heights
The total value of non-residential building permits surged 43.2% to $4.9 billion in February, largely reflecting large hospital permits in British Columbia and Quebec worth a combined $1.9 billion.
Construction intentions in the institutional component jumped 216.4% for the month, largely reflecting the $1.5 billion St. Paul’s Hospital project in Vancouver. Additionally, the $439 million permit for the second phase of le nouveau complexe hospitalier du CHU de Québec also contributed notably to this component.
The value of commercial permits gained 5.6% in February at the national level, with six provinces reporting increases. A $112 million Wawanesa Insurance office headquarters project caused the value of commercial permits in Manitoba to jump 337.4%.
The total value of industrial building intentions fell 27.9% mostly due to declines in Quebec (-44.8%) and Ontario (-28.8%).
To explore data using an interactive user interface, visit the Building permits: Interactive Dashboard.
To explore the impact of COVID-19 on the socioeconomic landscape, please consult the Canadian Economic Dashboard and COVID-19.
For more information on housing, please visit the Housing statistics portal
Print this page